Introduction
The pandemic is changing people’s travelling patterns, but it is not just about traffic volume. In most US cities, traffic dropped during the pandemic due to stay home orders and remote working, but the traffic patterns also changed. For instance, ridership on public transportation has decreased more significantly compared to private cars. In addition, there was a spike in traffic deaths and injuries in some cities.
In this project, we examined the change in spatial pattern of car crashes in major US cities after COVID-19. We chose New York and Chicago as examples because they are some of the most influenced cities by the pandemic and have adopted lockdown and other measures to restrain mobility. Our research scope is from March to October 2020, and historic data is also trimmed to this 10-month interval. We also preprocessed the data to drop any census tract with no or extremely low numbers (n<10) of crashes in the past few years.
The following hex bin maps demonstrated the spatial distribution of crashes before and after pandemic in the city of Chicago:
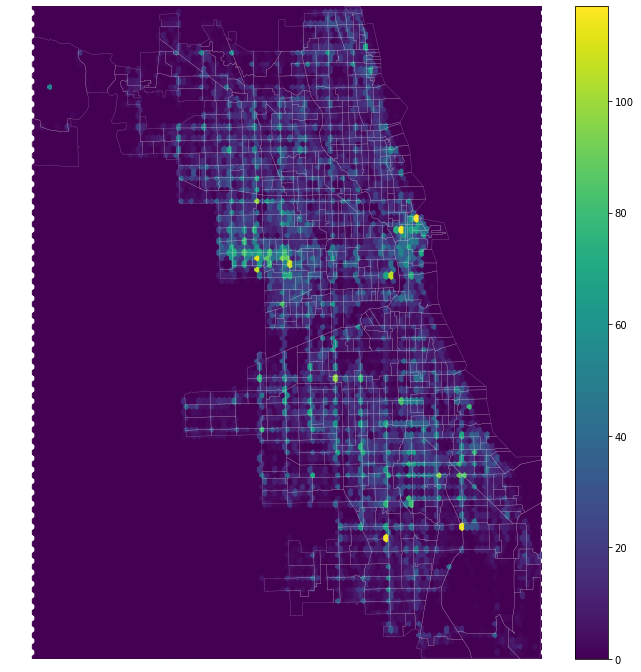
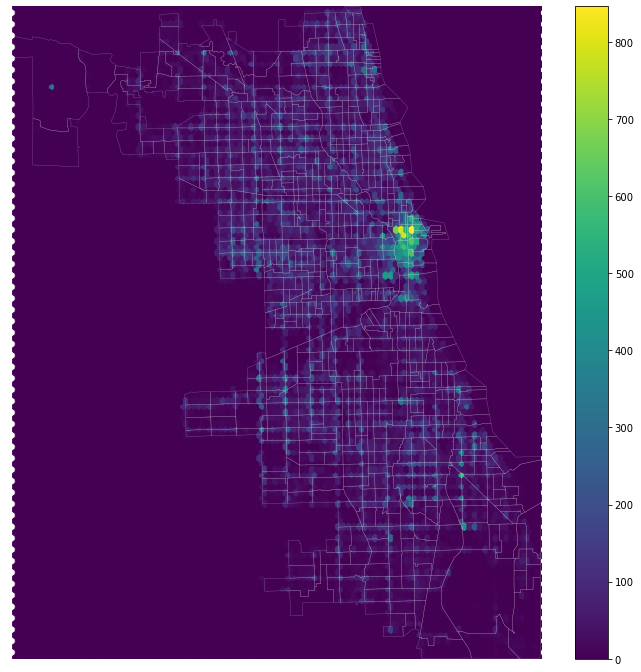
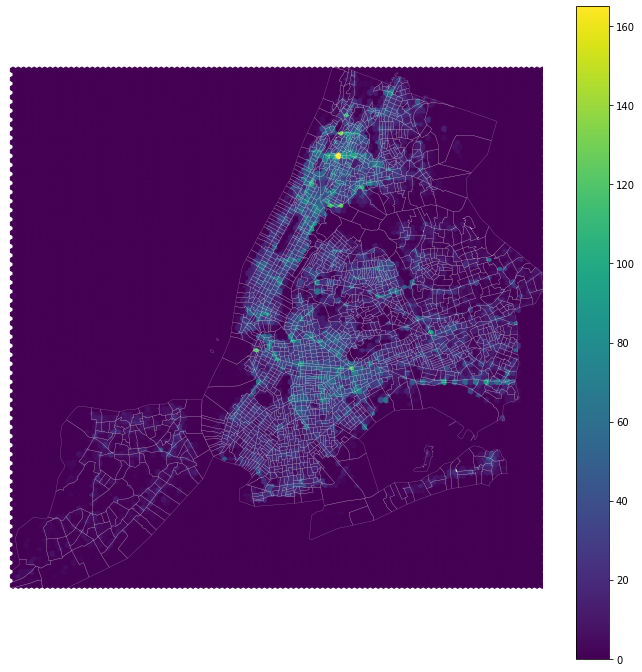
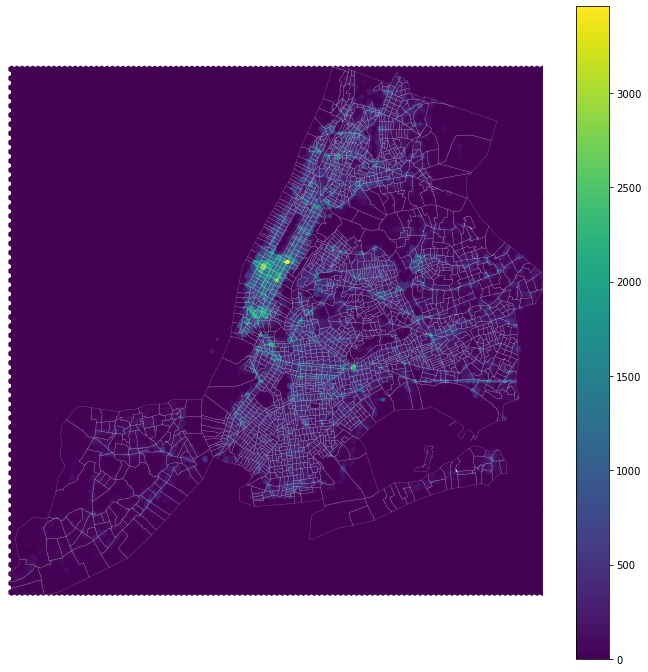
As we compare the above hex bin maps, we can see that there is some difference between 2020 car crash patterns and the 2013-2019 general trends. We shall look deeper into the trends in the following sections. The same is true in the city of New York:
References:
- The Philadelphia Inquirer, Philadelphia’s traffic congestion was bad before the pandemic. It could get worse.
- City Mayors Research, American cities and Covid-19
- Apple Maps, Mobility Trends Reports
- NYC Open Data, Motor Vehicle Collisions - Crashes
- Chicago Data Portal, Traffic Crashes - Crashes