Spatial Trends
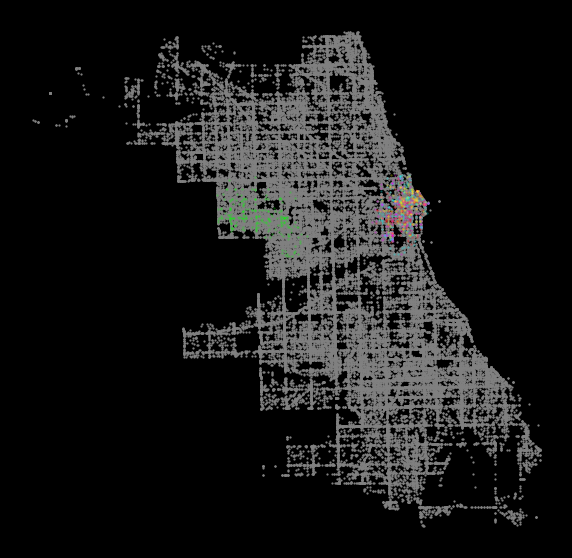
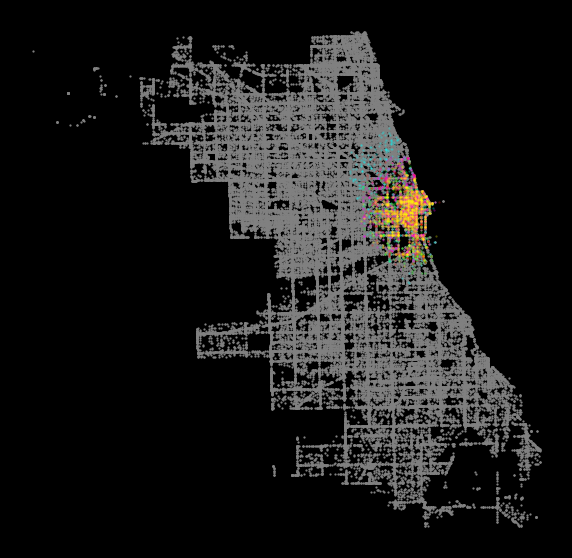
Chicago
This section examined the spatial changes of crash patterns in Chicago.
Trend by Tract
Below is a choropleth map of the crashes in 2018, 2019 and 2020. Note that there is some difference between 2020 car crash patterns and the 2018-2019 general trends:
Change in Pandemic
Below is a choropleth map of the change rate (%) of crashes in each census tract, from 2019 to 2020:
Clustering
To better understand the spatial patterns of crashes, we did a clustering analysis using dbscan method in scikit-learn. Below is the clustering result (top 5 groups) in 2020:
Below is the clustering result (top 5 groups) in 2019. Note that there is a unique cluster in 2020 that dis not appear in 2019, which is an area of interest for us in the following section:
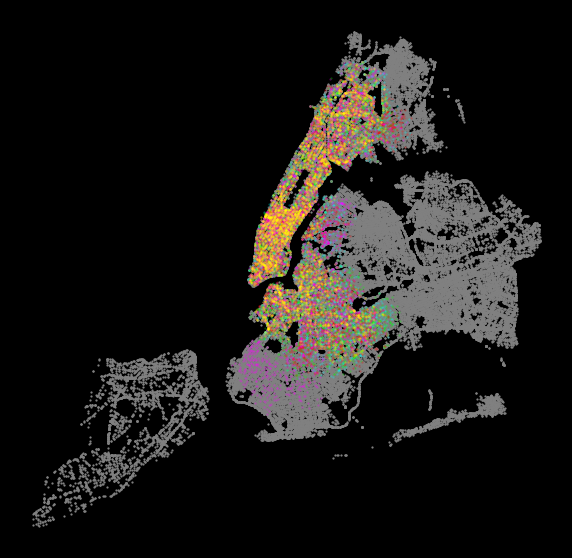
New York
This section examined the spatial changes of crash patterns in New York.
Trend by Tract
Below is a choropleth map of the crashes in 2018, 2019 and 2020. Note that there is no significant difference between 2020 car crash patterns and the 2018-2019 general trends:
Change in Pandemic
Below is a choropleth map of the change rate (%) of crashes in each census tract, from 2019 to 2020:
Clustering
To better understand the spatial patterns of crashes, we did a clustering analysis using dbscan method in scikit-learn. Below is the clustering result (top 5 groups) in 2020:
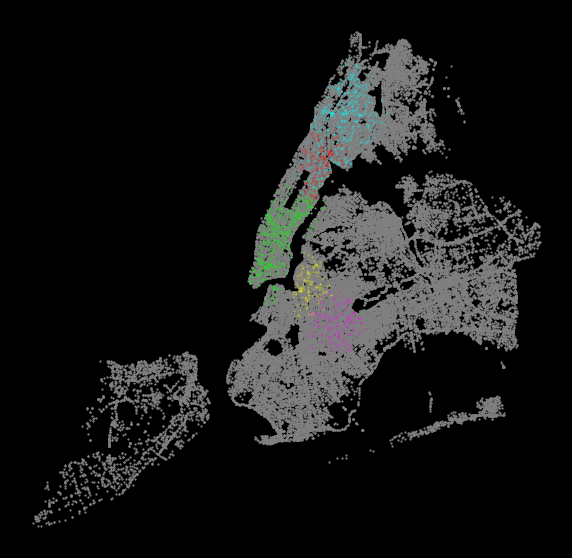
Below is the clustering result (top 5 groups) in 2019. Note that the cluster patterns are significantly different from 2020: